Analysis Reports
Overview
If you don't know how to use analysis reports you are not getting the best results out of your system. You should be using Readysell's key reports documentation to define most of your reporting requirements and you should be using analysis reports for your custom management reports. You can handle about 90% of your new report requests yourself if you know how to use analysis reports. Analysis reports can answer most of your business questions, but only if you know how to drive them Allow a few hours for analysis report training. This will probably be the most productive training time you could invest in. Analysis allows you to drill into, to slice and dice your data just about any way you can think of So Analysis reports can answer over 90% of your custom management reporting requirements without you having to have new reports built. Every Readysell user should invest about three hours training time in learning analysis reports. You must know what you are after before you start. Review your understanding of the business, your current processes and your existing reports. Then start your Analysis reports studies with at least an outline of an understanding of the information you need. If you are not using analysis reports, make sure you start doing so as soon as possible.. While analysis reports can't do direct comparisons between months. You can get the same result by filtering your analysis report to only show the months you want, then drop the month (period) into the columns area on the right of the report. The days/weeks/months you have selected will show right next to each other. Allowing you to do all the comparisons you like. Analysis reports can eliminate all the analysis spreadsheets you are currently building from data contained in your system. If you are analysing prices, contracts, stock, sales people etc. manually, stop doing so! Analysis reports can give you better information and save you hours of time. Analysis reports give you greater flexibility to drill into your data then any other type of report but can be harder to use. Analysis allows you build a three dimensional view of your data by dragging, for example, columns like sales person and customer to the left of a list, month to the top and sales value to the middle. This allows almost endless report possibilities without custom programming. Best practice is to use form reports for standard requirements and analysis reports where customisation or deeper analysis is required. Unless you are using both form and analysis reports, you are probably not getting the most from your Readysell system. This feature is not available in Readysell Lite.
Getting started
- Creating a new analysis report
- Customizing a built in analysis report
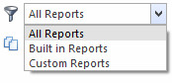
- Running an existing analysis report
- Analysis of current or historical product categories, sale persons and sale territories
- Converting Analysis Reports to a Graph
Reference
Buttons
Refer to Common Buttons
| Image | Name | Description |
|---|---|---|
 | Filter | |
 | Bind Data |
Settings tab
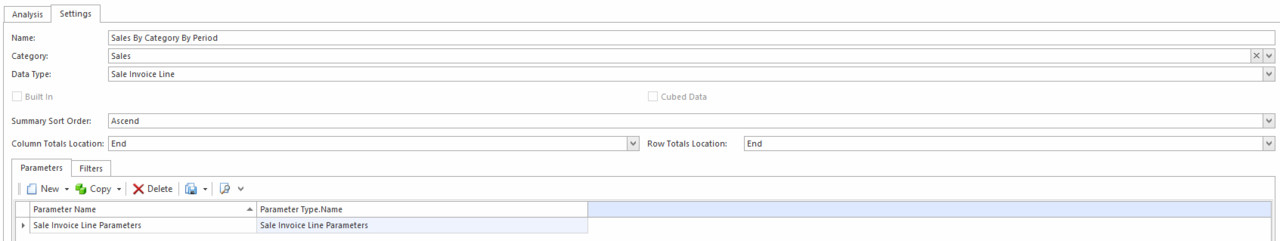
Fields
Field | Description |
|---|---|
| Name | The name of the report |
| Category | The category the report sits under |
| Data Type | |
| Built In | |
| Cubed Data | |
| Summary Sort Order | |
| Column Totals Location | |
| Row Totals Location |
Parameters tab
| Field | Description |
|---|---|
| Parameter Name | |
| Parameters Type Name |