Key Analysis Reports Overview
- John Nairn (Unlicensed)
- Diane Partridge
- Alisha Suapopo (Unlicensed)
- Sue Michael (Unlicensed)
Analysis reports allow you to drag and drop fields to produce a three dimensional view of your data. The level of detail can be easily scaled from summary to as detailed as you like. Analysis reports are a harder to learn than form reports, but the training investment required to make best use of analysis reports will more than pay for itself.
The drag and drop process used to build analysis reports means the exact analysis report layouts you may end up using is harder to define compared to form reports. The list below is intended to get you started. Most sites have some custom management reporting requirements. Analysis reports can be used to fill most gaps where the standard form reports don't quite cover all your business requirements.
Notes:
(1) Built in reports are deployed as standard with the Readysell system. Additional reports may be downloaded into Readysell by clicking on the Readysell store button above the reports list views. The reports with 'No' in the built in column are available from the Readysell store. You can easily download them into your system by clicking the Readysell store button.
(2) Readysell uses a data "cube" process to improve performance of some reports. Some of the reports will show as blank if the appropriate cube is not turned on for your site. If required contact Readysell support to assist with appropriate setup of the data cube task for your site.
ReportID | Report Name | Built In (1) | Category | Key Columns | How To Run The Report (2) | Purpose | Show Me |
|---|---|---|---|---|---|---|---|
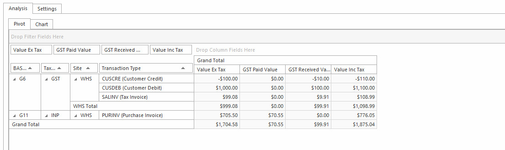
| A-001 | GST Summary | Yes | Financials | Bas Code, Tax Code, Site,Transaction Type, Value Ex Tax, GST Paid Value, GST Received Value, Value Inc Tax, Grand Totals | Reports >Analysis> Double click on the report > Click on Bind Data > Select the Filter or Parameter> Select your criteria | This report outputs a one line summary for each Bas Code, the Total Value Ex, Total GST Paid, Total Gst Received and Total Value Including the GST for the date or period range selected and then an overal total. |
|
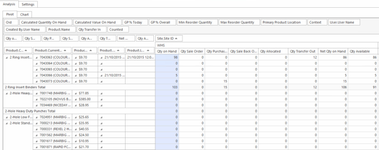
| A-002 | Live Stock Report | Yes | Inventory | Product Category, Product Display Name, Pricing, Last Received, Last Shiped, Qty on hand, Qty on Sales Order, Qty on Purchase Order, Qty on Sales Backorder, Qty allocated, Qty Transfer out, Net Qty on Hand, Qty Available, Grand Totals. | Reports >Analysis> Double Click on the report > Click on Bind Data > Select the Filter or Parameter> Select your criteria | This report is as it states , LIve stock as of the time it is run. Gives you an indication of what makes up the nett result of Qty Available. |
|
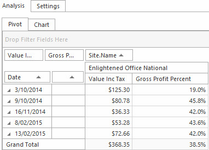
| A-003 | Sales By Day By Site Analysis | Yes | Sales | Date, Value Inc, Gross Profit % | Reports >Analysis> Double Click on the report > Click on Bind Data > Select the Filter or Parameter> Select your criteria | This report is summarised by Day to give you an overall total by Day of the Dollar Value of Sales Inc GST and GP% . | |
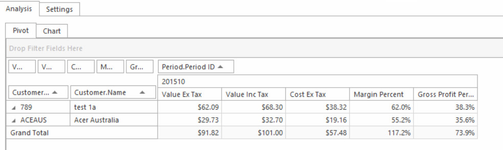
| A-004 | Sales by Customer by Period | Yes | Sales | Customer Code, Customer Name, Period, Value Ex Tax, Value Inc Tax, Cost Ex Tax, Margin Percent, Gross Profit Percent, Grand Total | Reports >Analysis> Double Click on the report > Click on Bind Data > Select the Filter or Parameter> Select your criteria | This report is summarised for each cusotmer for each period to give you an indication of the Value of Sales along with Cost, Margin and GP% | |
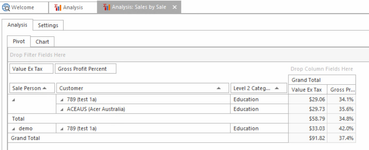
| A-005 | Sales by Sales Person by Customer by Category | Yes | Sales | Salesperson,Customer code and name, Category, Value Ex GSt, Gross Profit % | Reports >Analysis> Double Click on the report > Click on Bind Data > Select the Filter or Parameter> Select your criteria | This report is summarised by Salesperson to give the dollar value of sales for the Rep for each customer that has purchased . This report can also be used to work out the sales commissions for the sales people. | |
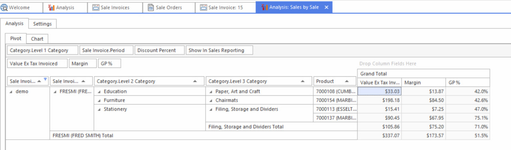
| Sales by Salesperson by Customer By Category Detailed | No | Sales | Sales Person, Customer, Level 2 and 3 Product Category and each invidivual product within that category, Value Ex Tax, Margn, GP%, Grand total | Reports >Analysis> Double Click on the report > Click on Bind Data > Select the Filter or Parameter> Select your criteria | Analyse sales person sales by customer and category by month. This report summaries the details to category level 3 and does not show individual product details for that category.This report is handy in identifying the sales for cost centres/departments which we classify as Product Categories |
| |
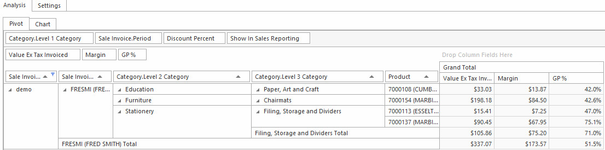
| Sales by Salesperson by Customer By Category By Product Detailed | No | Sales | Sales Person, Customer, Level 2 and 3 Product Category and each invidivual product within that category, Value Ex Tax, Margn, GP%, Grand total | Reports >Analysis> Double Click on the report > Click on Bind Data > Select the Filter or Parameter> Select your criteria | Analyse sales person sales by customer and category by month down to the individual product level. This report is handy in identifying the sales for cost centres/departments which we classify as Product Categories | | |
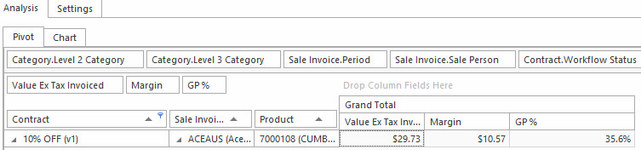
| Contract Sales By Customer By Product Detailed | No | Contract | Contract, Custmer Code and Name, Product and Product Name, Value Ex, Margin, GP% | Reports >Analysis> Double Click on the report > Click on Bind Data > Select the Filter or Parameter> Select your criteria | Used to identify the sales for Customers/Products that have been sold that have a Contract Price. | | |
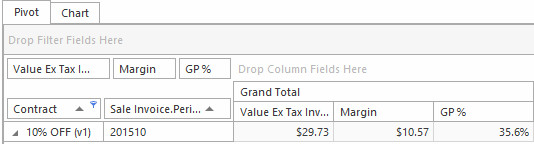
| Contract SalesSummary | No | Contract | Contract, Value Ex, Margin, GP% | Reports >Analysis> Double Click on the report > Click on Bind Data > Select the Filter or Parameter> Select your criteria | Used to identify the sales for a Contract in summary by period. | | |
| Sales by Salesperson Summary | No | Sales | Sales Person, Value Ex, Margin, GP% | Reports >Analysis> Double Click on the report > Click on Bind Data > Select the Filter or Parameter> Select your criteria | This report can be used to work out the sales person commsion. It is in summary format by Sales person for total value sold. | |