Key Performance Indicators
A Key Performance Indicator is a measurable value that demonstrates how effectively a company is achieving key business objectives. Organizations use KPIs at multiple levels to evaluate their success at reaching targets.
Overview
Key Features
Understanding your vital KPI statistics can assist identifying ways to improve your business efficiency, streamline processes and increase profitability.
- KPI Scorecard feature provides a list of common metrics to measure your store performance across a range of vital categories such as
- Sales
- Service
- Customers and Supplier Payments
- General Ledger
- KPI Scorecard is based on a set of highly customised KPI Definitions that provides
- a view of your current performance and trending
- comparison with the PCP (Previous Corresponding Period)
This feature is not available in Readysell Lite.
The topics in this section provide information on the Key Performance Indicators feature of Readysell.
Reference
KPI Definitions
Definition tab
Fields
| Field | Description |
|---|---|
| Name | KPI name. |
| TargetObjectType | The type of business category the KPI is designed for.TypeT |
| Criteria | Specifies the Criteria Language expression that is used to calculate each measurement item based on theMeasurementFrequency property. The CurrentValue of the entire KPI instance represents the last measurement value. |
| Direction | The Direction { LowIsBetter, HighIsBetter } enumeration value specifies how to treat deviation from a previous measurement result. |
| ExpressionExpressionE | An expression that is used to evaluate KPI - Sum, Count, Avg, etc. |
| Range | The period to analyse. |
| Compare | The Boolean flag that indicates if current KPI values should be compared to previous values, calculated using the RangeToCompare period. |
| RangeToCompare | The past period to be compared with the Range. |
| MeasurementFrequency | The Range is split into intervals, and MeasurementFrequency specifies the size of each interval. For each interval, a KPI value is calculated. |
| GreenZone, RedZone | Specify the KPI value’s "green" and "red" ranges that can be used for visualization. You can defineConditional Appearance rules that take these values into account. |
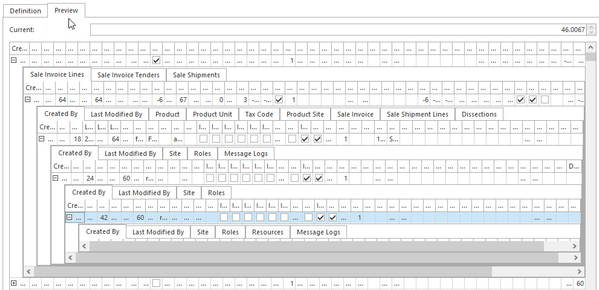
Preview tab
In a Preview tab, the current KPI value and the collection of objects used to calculate KPI are available.
KPI Scorecards
Fields
| Field | Description |
|---|---|
| Name | Scorecard name |
Indicators Name | Name of the KPI |
| Period | Specified KPI range to compare |
| Current | Calculated current period value as specified in the KPI Expression e.g. AVG(Margin) |
| Previous | Calculated previous period value as specified in the KPI Expression e.g. AVG(Margin) |
| Change | Current versus Previous change expressed in percentage |
| Trend | Better, No Change or Worse |
| Sparkline | Visual representation of
|
Buttons
Refer to Common Buttons.
| Button | Description |
|---|---|
| Insert | Add KPI to Scorecard |
| Remove | Delete KPI from Scorecard |
| Clear KPI Cache | Cleaning outdated values from the cache |
| Show Chart | Show KPI results as chart |
, multiple selections available, Use left or right arrow keys to navigate selected items
